Stop losing work in chat. Start organizing it.
Stop losing work in chat. Start organizing it.
Join the teams who turned their conversations into their competitive advantage
Join the teams who turned their conversations into their competitive advantage
Join the teams who turned their conversations into their competitive advantage
Set up in 5 minutes. Cancel anytime.
Set up in 5 minutes. Cancel anytime.
Get Started Free - No Credit Card
Get Started Free - No Credit Card
Flow Dashboard Guide
Understand your organization’s full workflow at a glance.
Flow Dashboard is MAKi’s control center offering a high-resolution view of everything happening across your Hubs, members,
and tasks.
Just as an MRI or CT scan reveals what’s happening inside the body,
Flow Dashboard shows the health of your team’s operations.
Soon, MAKi Intelligence will diagnose bottlenecks and flag risks automatically.

Live Monitor
Track the most recent activities happening across all selected Hubs.
You can see new tasks, updates, comments, completions, and delays as they occur.
● Use this to understand momentum — who is active, what just changed, and what needs attention.
Live Monitor
Track the most recent activities happening across all selected Hubs.
You can see new tasks, updates, comments, completions, and delays as they occur.
● Use this to understand momentum — who is active, what just changed, and what needs attention.
Live Monitor
Track the most recent activities happening across all selected Hubs.
You can see new tasks, updates, comments, completions, and delays as they occur.
● Use this to understand momentum — who is active, what just changed, and what needs attention.
Live Monitor
Track the most recent activities happening across all selected Hubs.
You can see new tasks, updates, comments, completions, and delays as they occur.
● Use this to understand momentum — who is active, what just changed, and what needs attention.

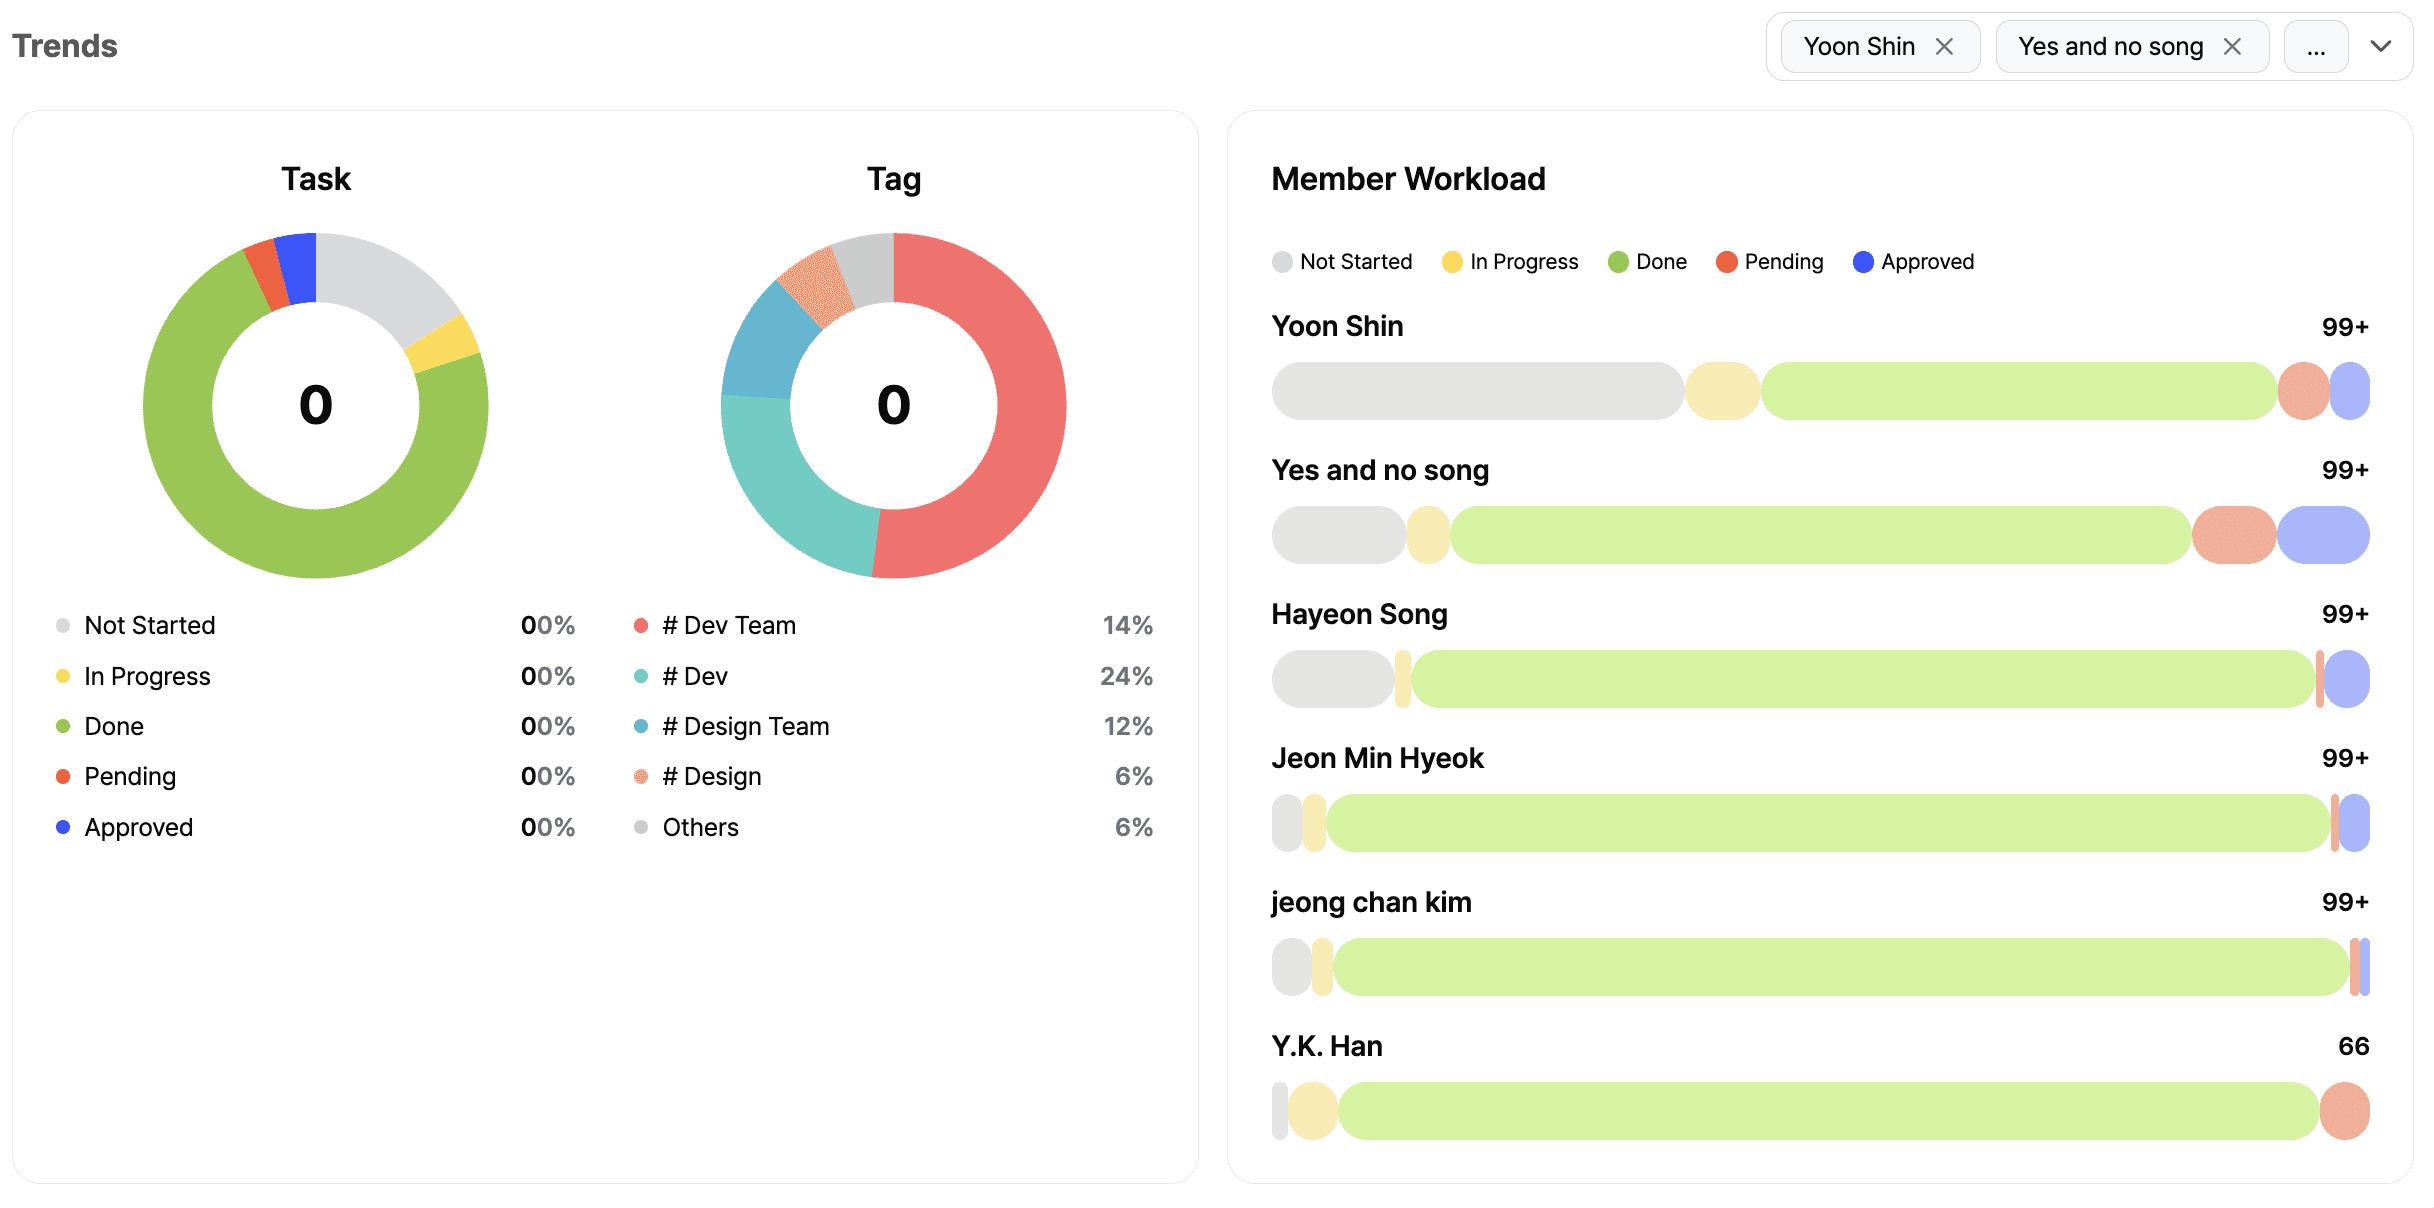
Trends
Visual summaries that reveal deeper patterns in your workflow:
● Task Status Breakdown
A donut chart showing the distribution of
Not Started / In Progress / Pending / Done / Approved
— helping you see whether your team is moving or stuck.
● Tag Distribution
See which departments or project themes (#Dev, #Design, etc.) are producing the most activity.
This helps teams identify where resources are concentrated and whether priorities match organizational goals.
🌐 The Vision: MAKi as Your Organizational MRI
Flow Dashboard is only the beginning.
Soon, MAKi Intelligence will:
Detect where members are struggling
Predict delays before they happen
Recommend workload redistribution
Suggest process improvements
Highlight unusual patterns in task behavior
Auto-summarize team performance weekly
Your team’s health will no longer be a mystery — MAKi will read the scans for you.
Stop losing work in chat.
Start organizing it.
Join the teams who turned their conversations
into their competitive advantage
Set up in 5 minutes. Cancel anytime.
Get Started Free - No Credit Card